舩橋研究員の論文がnpj Sustainable Agricultureに掲載されました。
Journal : npj Sustainable Agriculture
Title of paper: Power-law productivity of highly biodiverse agroecosystems supports land recovery and climate resilience
Authors: Masatoshi Funabashi
DOI : https://doi.org/10.1038/s44264-024-00014-4
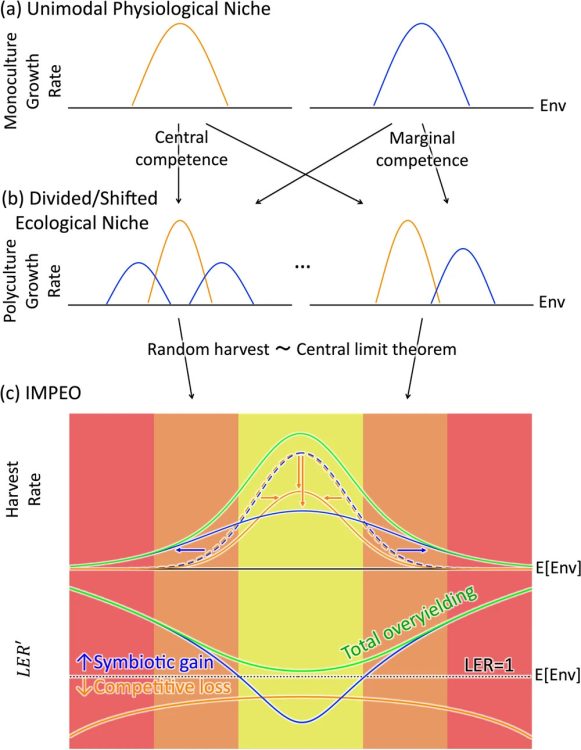
Fig. : Relationship between physiological and ecological optima and the total effect of overyielding.
a y-axis: examples of physiologically optimum isolated growth rate versus x-axis: environmental parameters such as temperature, precipitation, sunlight, etc. b y-axis: primary productivity of various ecological niches in the same environment (x-axis) but mixed communities. c Top: random sampling from various niches in a (blue and orange dashed lines) and b (blue and orange solid lines) converges to normal distributions via the central limit theorem, their frequencies correspond to mean productivity measures such as harvest rate (y-axis) under averaged environmental conditions (x-axis). The overall productivity (green line) includes the productivities of plants of both growth-rate types. c Bottom: Effects of symbiotic gain (blue line and arrows) and competitive loss (orange line and arrows) of plants with marginal and central competence, respectively, measured as the land equivalent ratio (LER) on the scale of LER′:=log(log(LER)+1). The main components of the total overyielding (green line) transit from centrally to marginally competent species as the environment shifts from the physiological optimum (yellow background) to marginal (orange background) and monoculture intolerant ranges (red background).
A paper by Masatoshi Funabashi has been published in npj Sustainable Agriculture.
Journal : npj Sustainable Agriculture
Title of paper: Power-law productivity of highly biodiverse agroecosystems supports land recovery and climate resilience
Authors: Masatoshi Funabashi
DOI : https://doi.org/10.1038/s44264-024-00014-4

Fig. : Relationship between physiological and ecological optima and the total effect of overyielding.
a y-axis: examples of physiologically optimum isolated growth rate versus x-axis: environmental parameters such as temperature, precipitation, sunlight, etc. b y-axis: primary productivity of various ecological niches in the same environment (x-axis) but mixed communities. c Top: random sampling from various niches in a (blue and orange dashed lines) and b (blue and orange solid lines) converges to normal distributions via the central limit theorem, their frequencies correspond to mean productivity measures such as harvest rate (y-axis) under averaged environmental conditions (x-axis). The overall productivity (green line) includes the productivities of plants of both growth-rate types. c Bottom: Effects of symbiotic gain (blue line and arrows) and competitive loss (orange line and arrows) of plants with marginal and central competence, respectively, measured as the land equivalent ratio (LER) on the scale of LER′:=log(log(LER)+1). The main components of the total overyielding (green line) transit from centrally to marginally competent species as the environment shifts from the physiological optimum (yellow background) to marginal (orange background) and monoculture intolerant ranges (red background).


